3D Compute Manager Week 3: Performance Optimization & Cost Visibility
Building the foundation for enterprise-scale GPU infrastructure management
Performance First: Faster Everything
We've been shipping features rapidly over the past few weeks, and need to do some performance rework.
Faster CRUD Operations: Adding and removing cluster elements should be much faster, especially on less powerful devices.
Caching Improvements: We’re using more of your RAM. The result should be much better performance.
Moved to IndexedDB
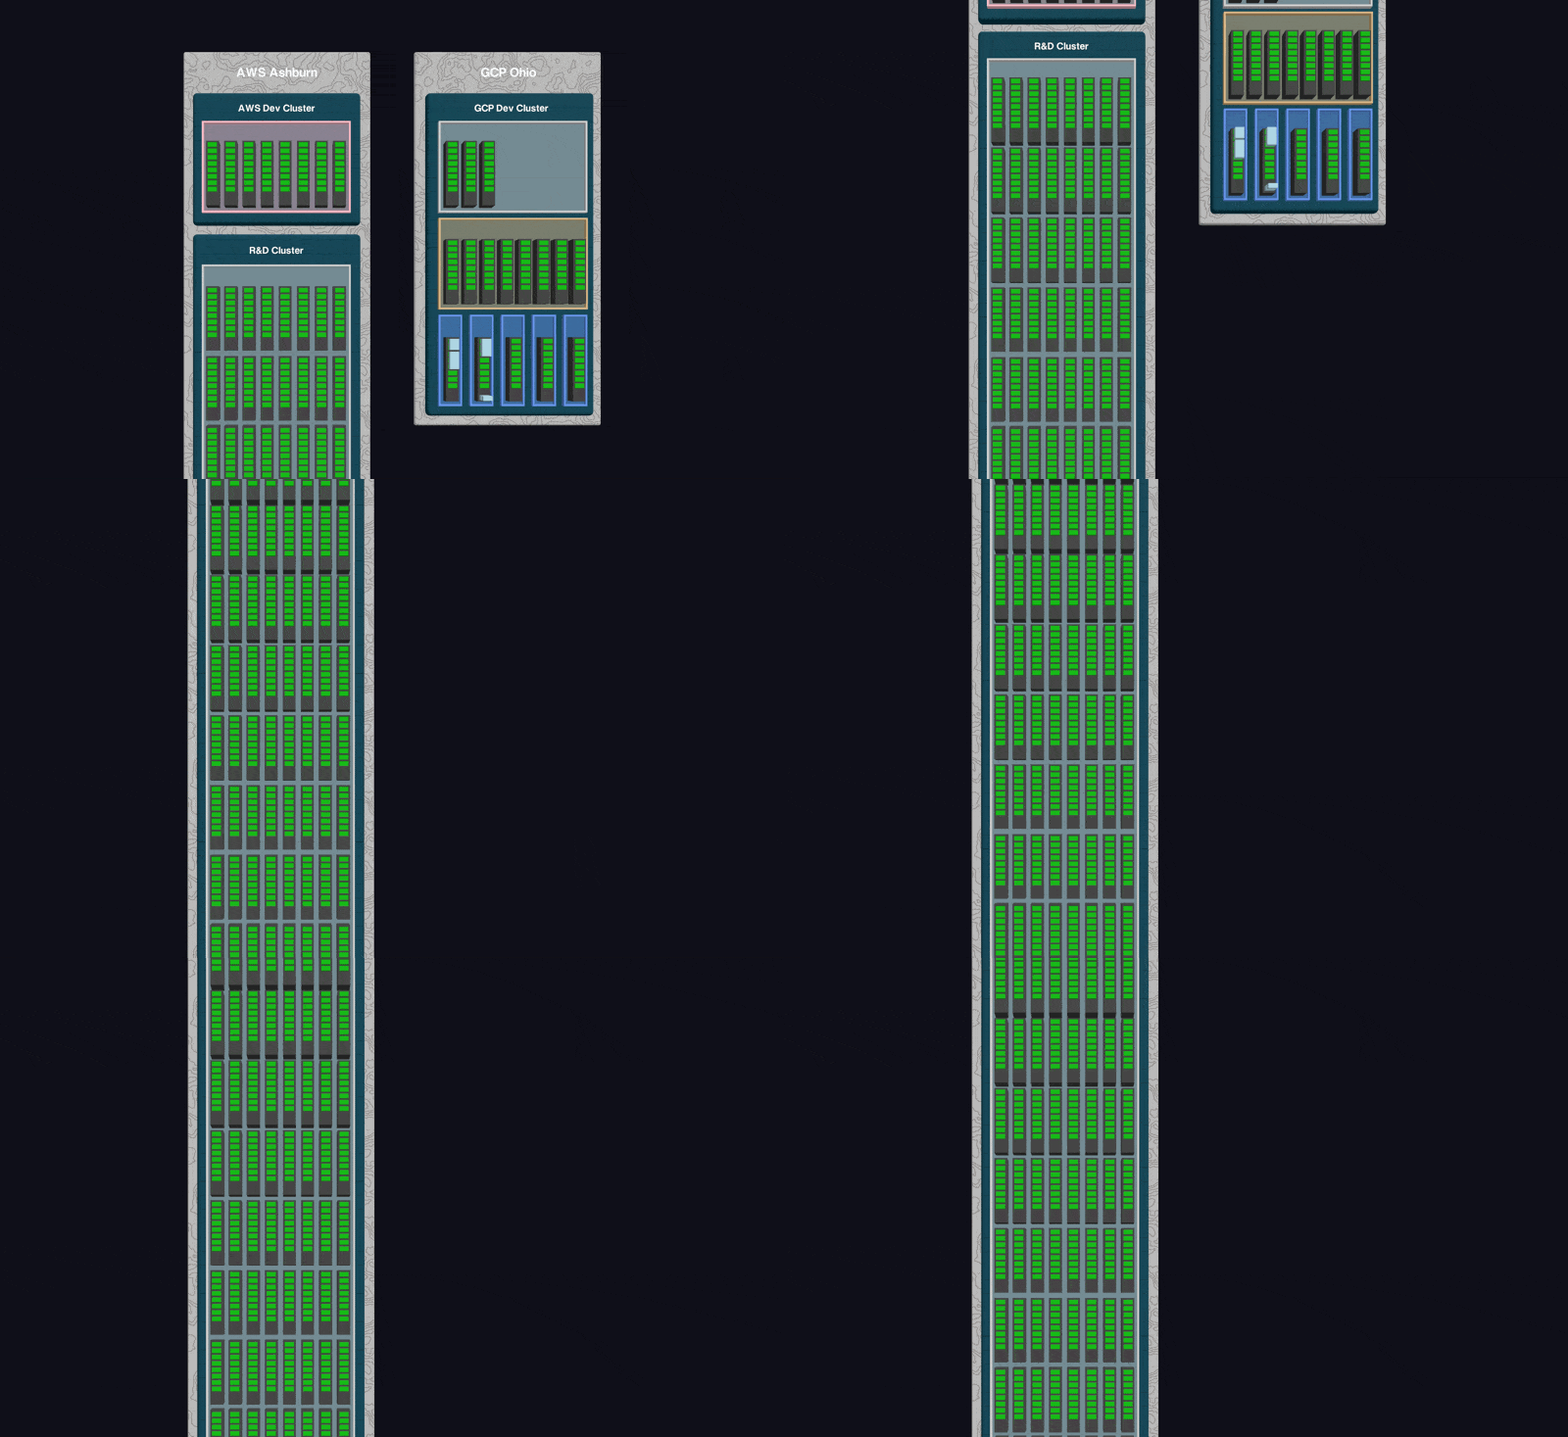
Previously we’d crash at the scale of entry level foundation labs ~2000 nodes.
New Storage Architecture: We now allow for a much higher limit.
Current Limitations:
Viewing 2,000 nodes isn’t great for usability. We’re have several research projects underway to look at the best way to visualise massive assets.
Graphics wise, at extremes of scale there’s some Z-fighting (things appearing on top of things when they should be underneath) that will also be dealth with
Real-Time Cost Tracking
Dynamic GPU assets traditionally makes costs unpredictable. Even with fixed assets resource consumption is a major factor for organization given the cost of the assets.
We’ve previously built sophisticated cost tracking, much of which is shared with users and we also have additional internal tooling.
This is all coming to our 3D view now
Node-Level Costs: Every node now displays its individual operating cost, updating continuously as market rates change.
Hierarchical Aggregation: Costs roll up automatically from nodes to spaces to clusters to regions. You can see the total cost impact of any infrastructure decision immediately.
Dynamic Pricing: The system simulates real-world cost fluctuations, showing how your expenses change as you scale workloads up and down.
Future Integration: While we're using simulated costs for now, this foundation will connect to real provider APIs to show actual spend across your multi-cloud infrastructure. And most importantly, spend over time and how this approaches limits.
Dynamic Node Statistics
Static infrastructure dashboards don't reflect reality. GPU utilization, temperature, and health change constantly based on workload demands.
Workload-Aware Monitoring: Idle nodes show minimal resource usage and stay cool. Busy nodes running intensive workloads display high VRAM usage and elevated temperatures.
Realistic Behavior: This isn't just cosmetic - it mirrors how actual GPU hardware behaves under different load conditions. In our live view it connects to real hardware metrics.
Health Predictions: The foundation is now in place to simulate hardware failure over time. Nodes that run hot consistently will eventually fail, just like in real data centers.
Building Toward Reality
Performance at Scale: The optimizations ensure the interface remains responsive when managing hundreds of clusters across multiple cloud providers.
Cost Visibility: Real-time cost tracking prevents the budget surprises that plague most GPU deployments.
Predictive Maintenance: Dynamic statistics and failure simulation will help teams anticipate hardware issues before they impact production workloads.
What's Next
Next week we’re focusing on storage infrastructure and resiliency. We're implementing NVMe drive simulation for each node to track storage capacity alongside GPU resources. More importantly, we're building resilience capabilities - when nodes fail, datasets and jobs will automatically redistribute and heal themselves across remaining infrastructure.
This moves us closer to simulating real-world distributed storage behavior where data redundancy and automatic recovery are critical for production workloads.
Strong Compute provides visual GPU infrastructure management across all major cloud providers. Subscribe to words.strongcompute.com for weekly product updates and follow our YouTube channel for video demos of new features.


